If you has read this article, I hope you has no restriction to understand the BSOD error’s message generated by computer. Today, I want to add a little explanation about this matter. Look at the picture below :
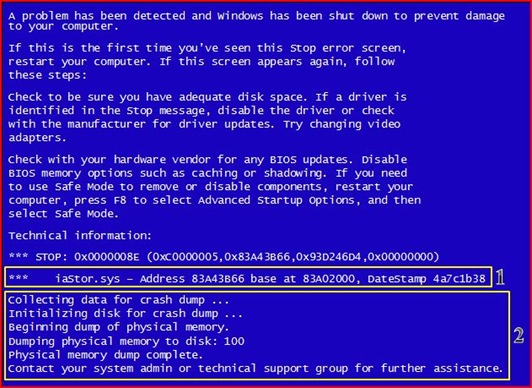
Sometimes, when computer generate BSOD, it also create the memory dump file (.dmp) which is very useful to be analyzed by computer technician, in order to know more deeply about what type of critical error encountered by Windows.
The steps of creating memory dump file usually shown at the bottom of BSOD error message (label no. ). So, when you see that part of message, you will know that a memory dump file had been created and saved in the C:\Windows\Minidump. The label no.
indicate the file (image) which you will need when start analyzing the memory dump file.
Now, based on the BSOD error message above, I will show you how to analyze the memory dump file. For your information this error occur in notebook with Windows 7 (x86) installed.
What You Need
- Debugging Tools for Windows. Download here. Please read this carefully before you download the tools.
- The file, iaStor.sys which you need to know its location (file path). In this case, its file path is C:\Windows\System32\drivers
Before The Procedures
I assume that you want to analyze this memory dump file using the known good computer. So, you need to do the following
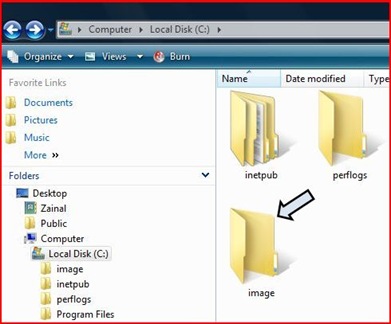
- Create the folder named image inside the C:\ drive of known good computer.
- Copy the file iaStor.sys (from the Windows 7’s notebook that encounter the BSOD error) and paste it into the folder C:\image that you created before.
- Copy the memory dump file (from the Windows 7’s notebook that encounter the BSOD error) and paste it into C:\Windows\Minidump folder reside in a known good computer.
- Install the Debugging Tools for Windows
The Procedures
- Click
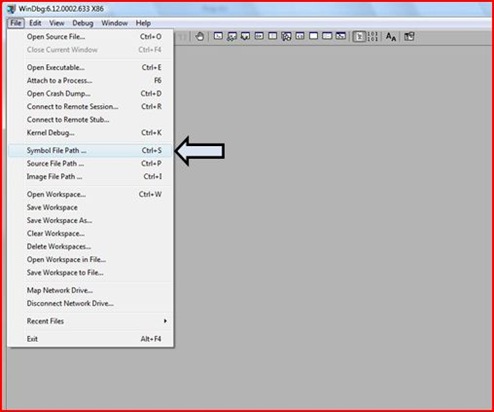
--> click All Programs –-> click Debugging Tools for Windows (x86) –-> click WinDbg –-> the WinDbg’s window like below appears.
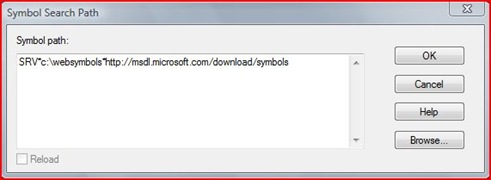
- Based on the picture above, click File –-> click Symbol File Path… –-> the Symbol Search Path’s window like below appears.
- Inside the text area under Symbol path, type SRV*c:\websymbols*http://msdl.microsoft.com/download/symbols –-> click OK.
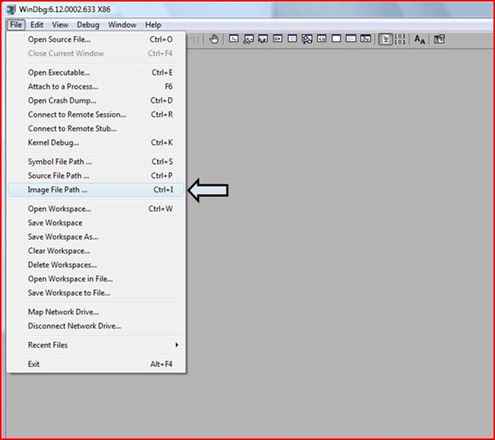
- Now, on the WinDbg’s window AGAIN, click File –-> click Image File Path…
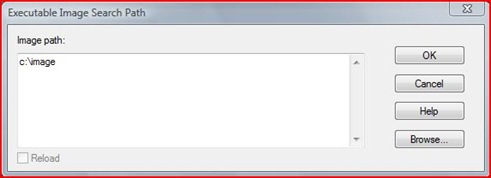
- The Executable Image Search Path’s window like below appears. Inside the text area under Image path, type c:\image --> click OK.
Note:
The c:\image is the folder reside in C: drive which you created at step 2 under section Before The Procedures. The content of this folder is the file iaStor.sys
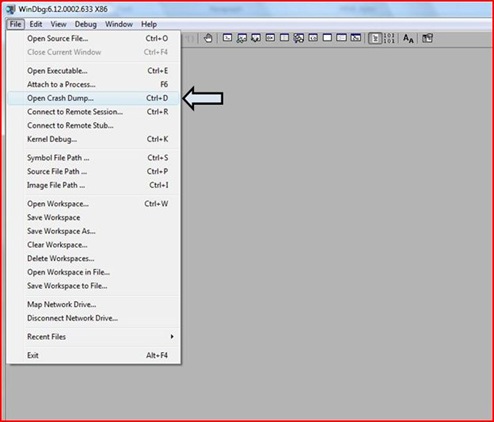
- Now, it is the time to open the memory dump file for deep analysis. Click File –-> click Open Crash Dump…
- Then, you will be re-directed to C:\Windows\Minidump –-> highlight the memory dump file –-> click Open –-> click Yes and you will get the result like below.
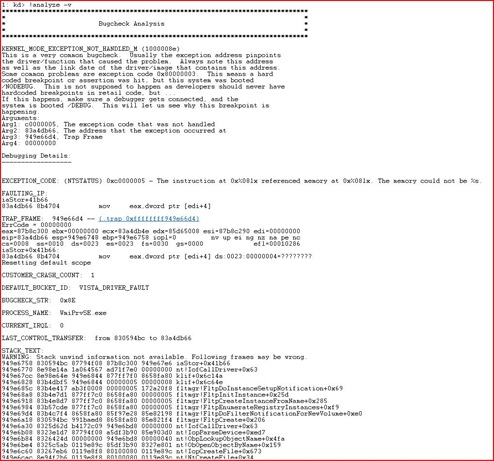
- If you want to get more details debugging information, click !analyze -v. Then you will get the detail information as below
- Based on the picture above, if you scroll down a little bit more, you will see the information like the picture below
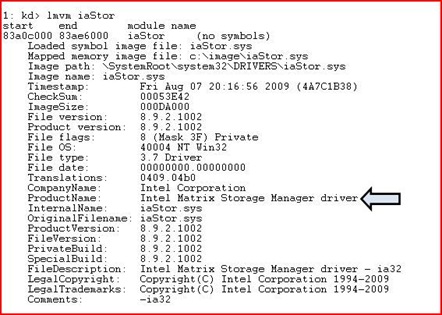
- Click the iaStor and you will be presented with the details information about the file iaStor.sys. See below
Conclusion
The another name for analyze memory dump file is debugging process. Actually the debugging process is a technique that need time to be learned and be mastered. Besides, the debugging process also time consuming to be done. What you learned in this article is the basic concept that you need to know in debugging process.
If you are interested to learn more about debugging process, here I give you the links which you can refer
- How to Analyze Memory Dump (.dmp) File
- How to read the small memory dump files that Windows creates for debugging
- If your computer had been installed with Debugging Tools for Windows, you can retrieve the complete documentation about debugging process at C:\Program Files\Debugging Tools for Windows\Debugger.chm





7 comments:
Thanx 4 da tutorial..boleh guna utk masa akan datang..
this is best bro..tq2..
There is application Digeus Registry Fixer I recommend to use it when there are problems with system. I also recommend to use Windows Tune Up Suite form Windsty. It restores system to a healthy state.
thanks bro..it is the best
Great tutorial.
Thank you for the good tutorial
Really Great tutorial. I will bookmark this page for tuture use and tell my friends also.
Post a Comment